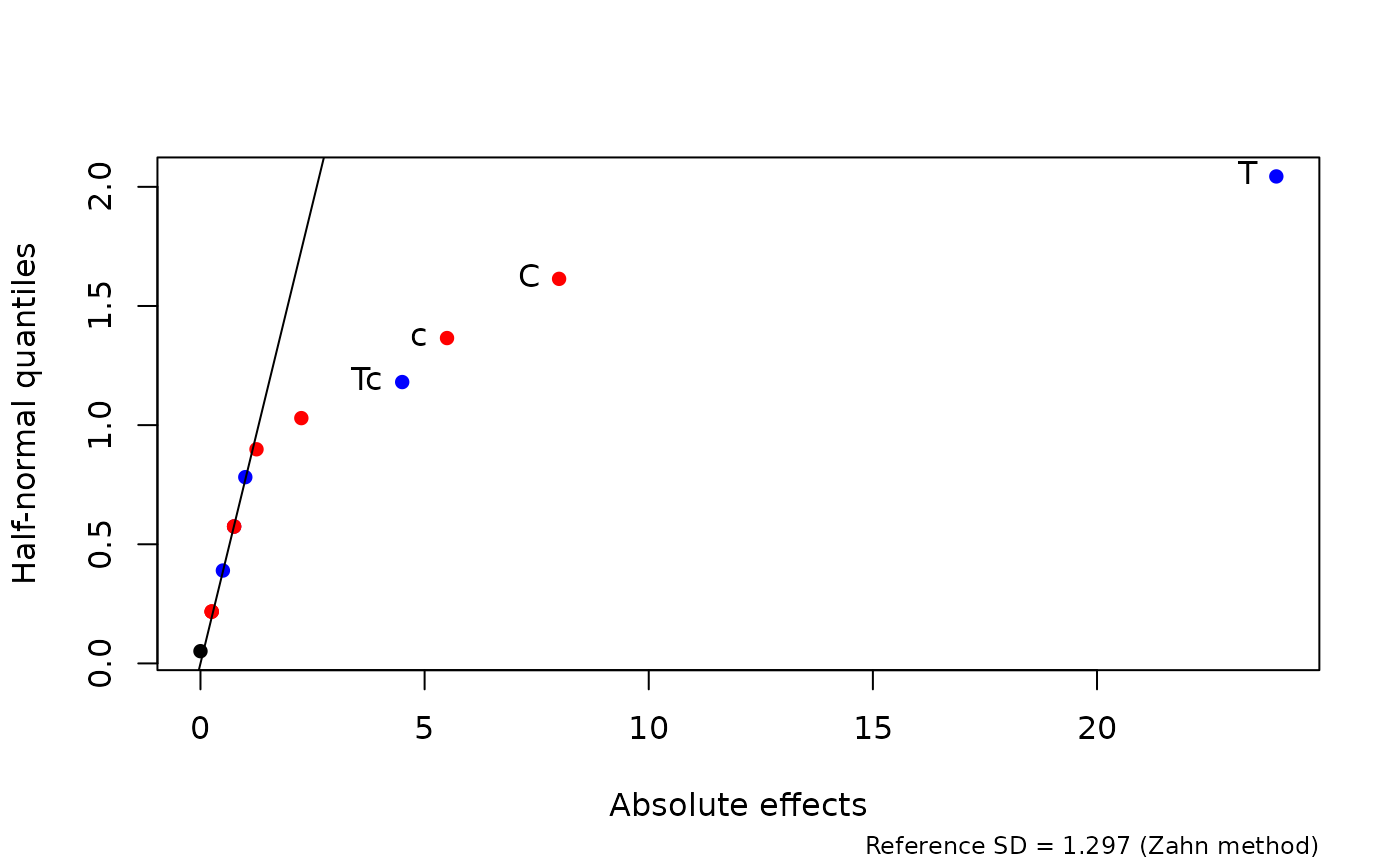
Half-normal plots (Daniel plots) of effects
hnplot.RdThe hnplot function constructs a (half-) normal plot of effects (see Daniel 1959) that is traditionally used to identify active effects in a screening experiment. Reference lines and various other options and extensions are supported.
Usage
hnplot(effects, ref = TRUE, half = TRUE, horiz = TRUE, method = "Zahn",
       a = 0.375, col = half, pch = 16, ID = FALSE, alpha, ...)
Arguments
- effects
Numeric vector of effects or contrasts to be explored.
- ref
Logical value. If
TRUE, a reference line is added to the plot determined bymethod. IfFALSE, no reference is shown.- half
Logical value. If
TRUE, a plot based on the absolute effects is constructed. IfFALSE(not recommended: see Details), the original signed effects are used.- horiz
Logical value. If
TRUE, the (absolute) effects are plotted on the horizontal scale and the (half-) normal scores or labels are plotted on the vertical scale. IfFALSE, these axes are reversed.- method
Character value. When
refisTRUE, the method to use in determining the reference line, curve, and/or critical values. This must be the name of a provided pseudo-standard-error method (seePSE), or a compatible user-supplied one.- a
The adjustment used in scaling and centering ranks in the interval (0, 1). The \(i\)th ordered (half-) normal score is computed as the \((i - a) / (n + 1 - 2*a)\) quantile of the reference distribution.
- col
Scalar or vector of colors; or a logical value. If logical, a value of
TRUEcolors the positive effects blue, the negative effects red, and any zeros as black. A logical value ofFALSEcolors them all black.- pch
Plotting character(s) to use.
- alpha
Numeric value. If specified, a null reference distribution for
methodis used (seeref.dist) to determine a margin of error (labeled ‘ME’) and simultaneous margin of error (labeled ‘SME’) corresponding to a significance level ofalpha, and reference lines are added to the plot at those positions as an aid to assessing the statistical significance of the effects. This is based on a suggestion in Mee (2015). These reference lines are omitted whenalphais left unspecified.- ID
Logical or numeric value. If logical and
TRUE, then after the plot is contructed, the plot is put inidentifymode, where the user may click on points to be labeled on the plot. If a numeric value is supplied, it is used as a threshold by which all effects greater thanID[1]in absolute value are labeled.- ...
Additional graphical parameters (see
par) used in constructing the plot.
Details
Use of half = FALSE is not recommended because it can be misleading to the user. Inactive effects are those that are close to zero, and a regular normal plot displays deviations from normality rather than deviations from zero.
References
Daniel, C (1959) Use of Half-Normal Plots in Interpreting Factorial Two-Level Experiments. Technometrics, 1(4), 311-341
Mee, R (2015) Discussion: Better, not Fewer, Plots. Journal of Quality Technology, 47(2), 107-109