Pareto plot of effects
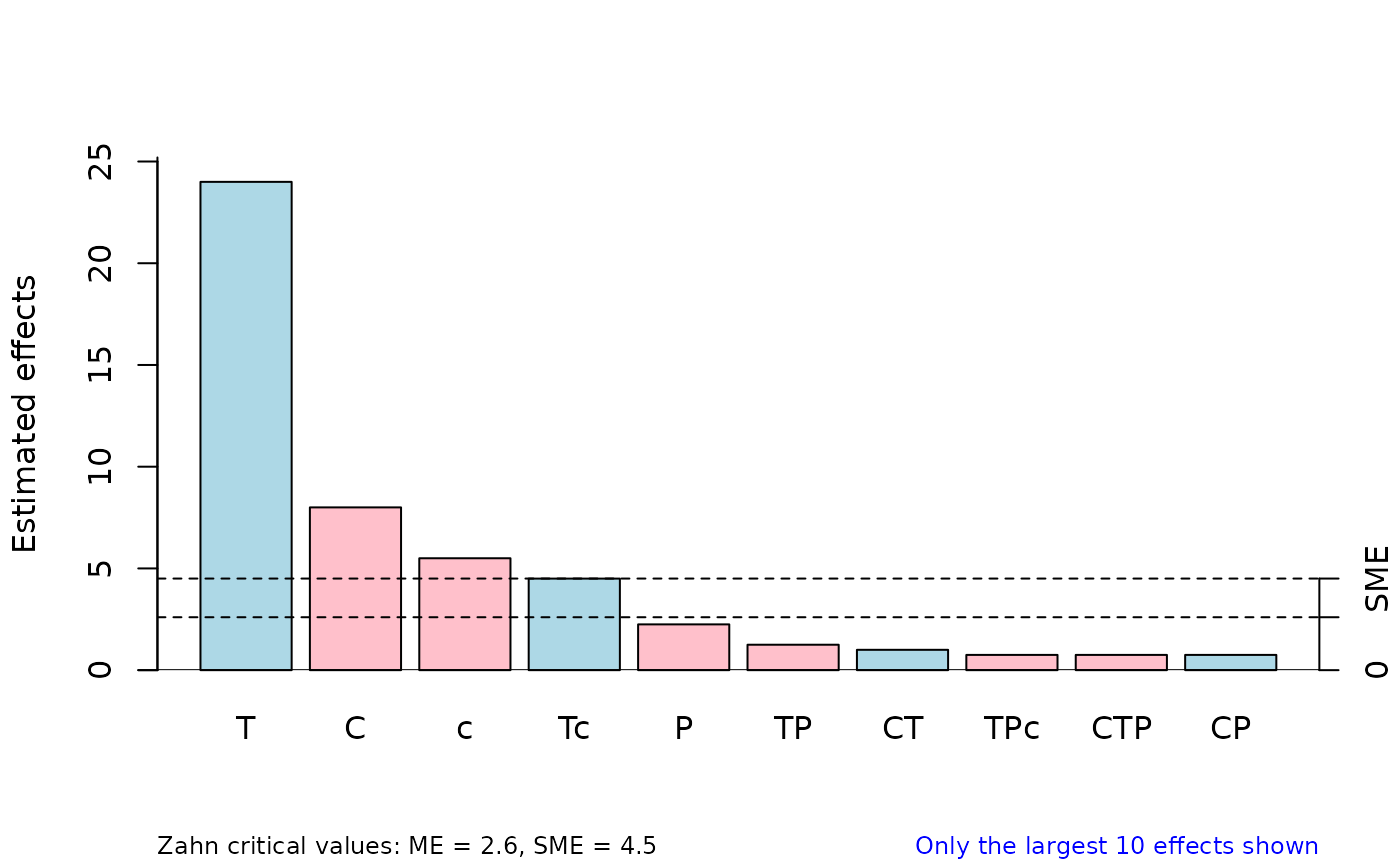
parplot.RdConstructs a bar plot of ordered effects, along with cutoff values for the margin of error (ME) and simultaneous margin of error (SME). Such a plot is suggested in Lenth (1989), but other methods may be used for obtaining the ME and SME.
Usage
parplot(effects, pareto = TRUE, absolute = TRUE, horiz = FALSE, col = absolute,
    critvals, method = "Zahn", alpha = .05, refdist, sim.opts,
    ylab = "Estimated effects", top = n.effects, cex.annot = 0.75, ...)
Arguments
- effects
Numeric vector of effects or contrasts to be explored.
- pareto
Logical value. If
TRUE, the effects are plotted in decreasing order of their absolute values.- absolute
Logical value. If
TRUE, the absolute effects are plotted. IfFALSE, the original signed effects are used, so that there are potentially positive- and negative-going bars in the plot.- horiz
Logical value. If
TRUE, the bars are horizontal, and ifFALSE, they are vertical.- col
A logical value, or valid color code(s) or names(s). If logical, a value of
TRUEshades the positive effects in light blue, and the negative effects in pink. A logical value ofFALSEcolors them all light gray.- critvals
Numeric value(s). If these are provided, the first two elements of
critvalsare used as the ME and SME respectively (on the absolute scale of the effects). Whencritvalsis specified,method,alpha, andrefdistare ignored.- method
Character value designating the method to use in determining the margins of error displayed in the plot when
critvalsis not given. This must be the name of a provided pseudo-standard-error method (seePSE), or a compatible user-supplied one.- alpha
Numeric value. A null reference distribution for
methodis used (seeref.dist) to determine a margin of error (labeled ‘ME’) and simultaneous margin of error (labeled ‘SME’) corresponding to a significance level ofalpha, and reference lines are added to the plot at those positions as an aid to assessing the statistical significance of the effects.- refdist
A result of
ref.dist. If given, it is used to obtain critical values, rather than running a new simulation of the null distribution. The user should be careful thatrefdistindeed matchesmethodand the number of effects.- sim.opts
A
listcontaining argumentsnsetsand/orsaveto pass toref.distin case a new reference distribution needs to be simulated. See also details below.- ylab
Character axis label (overrides the default).
- top
Numeric value giving the number of effects to display (this may help make all the important effect names visible). When
topis less than the number of effects (n.effects), this forcespareto = TRUEand only the largesttopeffects are displayed. When this happens, an annotation is added to the plot to help clarify that not all effects are displayed.- cex.annot
Character magnification for annotations
- ...
Additional graphical parameters (see
par) used in constructing the plot.
Details
The cutoff values displayed in the plot are labeled “ME”, the margin of error, and “SME”, the simultaneous margin of error. If not specified using crtivals, they are obtained using the 1-alpha quantiles of the reference distribution of absolute pseudo-\(t\) ratios. ME is based on the distribution of \(|t|\). SME is based on the distribution of the maximum \(|t|\) for a whole set of null effects.
In determining cutoff values, parplot tries to avoid re-simulating the reference distribution. Specifically, if the global variable .Last.ref.dist exists, and its contents match the given method and number of effects, it is used as the reference distribution. Similarly, if refdist is supplied, it is used (without checking). If a suitable reference distribution is not found, then it is simulated via ref.dist, with any arguments from sim.opts added.
If critvals is supplied, the specified values are used as the ME and SME: no reference distribution is needed, and hence method, alpha, and refdist are ignored.
The plot is scaled so that the ME cutoff always shows. The SME cutoff will only be visible if an observed effect is near or exceeds that boundary. The numeric values of the ME and SME are also shown in an annotation in the plot.
References
Lenth, R (1989) Quick and Easy Analysis of Unrelicated Factorials. Technometrics 31(4), 469-473
See also
For more details on PSEs and reference distributions, see PSE and ref.dist. Note that parplot produces in essence a graphical version of the information from eff.test, but the latter provides more resolution in terms of \(P\) values.
Other graphical ways of assessing active effects include a dot plot with a reference curve (refplot) and a half-normal plot (see hnplot).