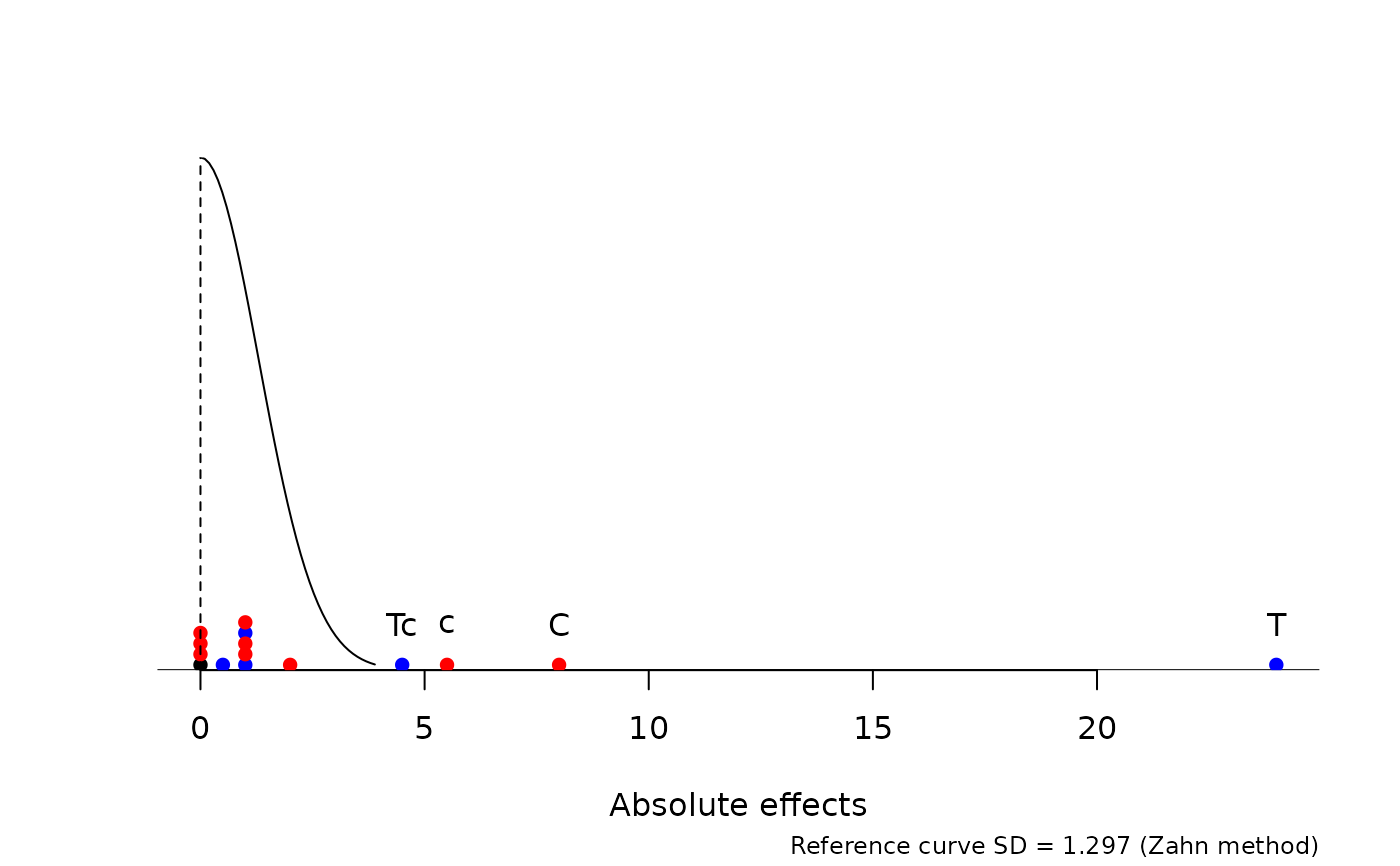
Dot plot of effects with a reference distribution
refplot.RdThe refplot function constructs a dot plot of effects along with a rweference distribution (either normal or simulated) to help in visually identifying active effects in a screening experiment.
Usage
refplot(effects, ref = TRUE, half = TRUE, method = "Zahn",
    col = half, guides = FALSE, ID = FALSE, pch = 16, xlab, xlim, ...)
Arguments
- effects
Numeric vector of effects or contrasts to be explored.
- ref
Logical or character value. If
TRUE, a reference line or curve is added to the plot determined bymethod. IfFALSE, no reference is added to the plot.A character value matching
"normal"or"simulated"is also permitted."normal"is equivalent toref = TRUE. With"simulated", , a kernel density estimate is displayed; it is obtained by scaling the simulated reference distribution for"method"by its observed PSE.- half
Logical value. If
TRUE, a dot plot of the absolute effects is constructed. IfFALSE, the original signed effects are plotted.- method
Character value. When
refis not false, the method to use in determining the PSE for scaling the reference curve (and also the method used for simulating the referemnce distribution whenref = "simulated"). This must be the name of a provided pseudo-standard-error method (seePSE), or a compatible user-supplied one.- col
Scalar or vector of colors; or a logical value. If logical, a value of
TRUEcolors the positive effects blue, the negative effects red, and any zeros as black. A logical value ofFALSEcolors them all black.- guides
Logical value. If
TRUE, dotted lines are added that illustrate guide lines that could be used to draw the normal curve by hand.- ID
Logical value. If logical and
TRUE, then after the plot is contructed, thedot.idinvoked so that the user may click on points to be labeled on the plot. If a numeric value is given, it is used as a threshold by which all effects greater thanID[1]in absolute value are labeled.- pch, xlab, xlim, ...
Additional graphical parameters (see
par) passed todot.plot.
Details
If the returned environment is saved, then dot.id or dot.mod may be used later as for dot.plot results.
